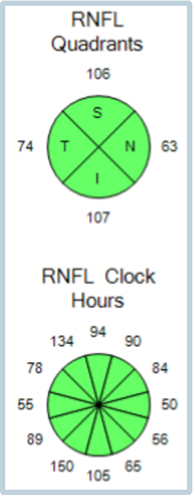
There are two Pie Charts depicting the same RNFL Circular Tomogram data in different ways. One divides the data into quadrants, while the other divides the same data into clock hours. The two different displays (of the same data) allow the user to look for diffuse changes using the quadrant pies and focal changes using the clock-hour pies. The combination of these data limits the risk of overcalling disease. Meanwhile, each section is color coded to allow for statistical interpretation.