- RNFL Across the Entire Scan
- RNFL Circular Tomogram
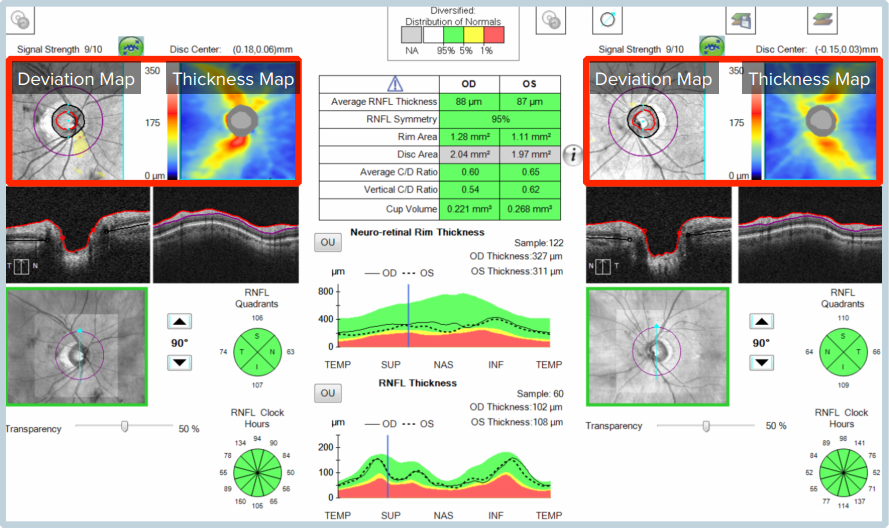
RNFL data calculated across the entire scan are displayed in the RNFL Thickness Map and RNFL Deviation Map.

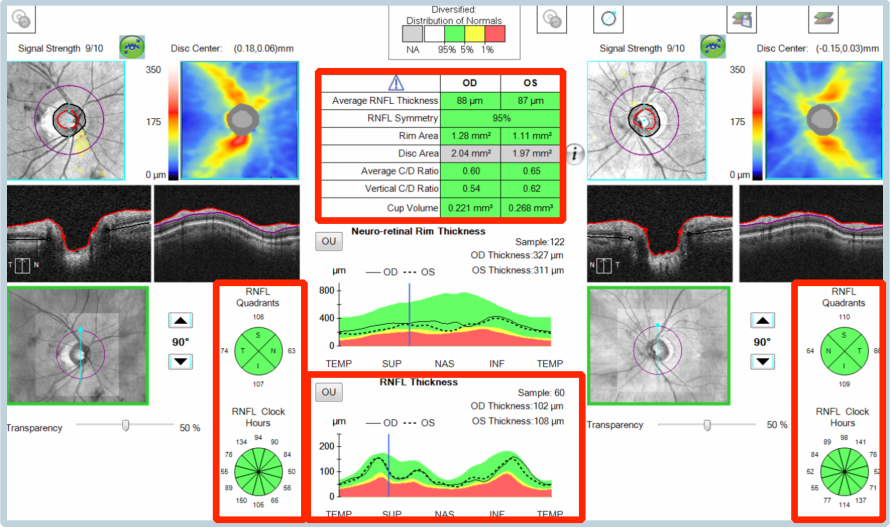
RNFL data calculated across the 3.47-mm circular cut-out is known as the RNFL Circular Tomogram. The data from the Circular Tomogram are displayed in various ways— in the Tabular Data, in the Pie Charts and in the Graphical Data.

This Circular Tomogram has been well proven in clinical research as a surrogate measure for Glaucomatous Optic Neuropathy.