EyeCarePD

A Clear Vision for Professional Development

  • Catalog
  • FAQ
  • Blog
  • About
  • Contact Us
  • English
  • Log in

Tabular Data

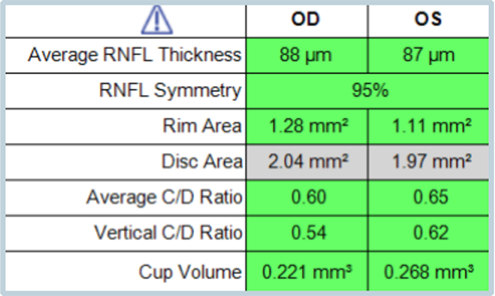
There are a number of pieces of data within the table and each is displayed with a background color to denote its statistical significance.

  1. Average RNFL Thickness
  2. RNFL Symmetry
  3. Rim Area
  4. Disc Area
  5. Average C/D Ratio
  6. Vertical C/D Ratio
  7. Cup Volume

Note that for some of these variables there is not a well-defined comparison group. In such cases, the background color will be indicated as grey to denote that statistical comparisons are not available for this variable.

« Bell Curve
Average RNFL Thickness »
  • Glaucoma Glossary
    • Scan Quality
      • Date of Birth
      • Signal Strength
      • Movement Artifact
    • Where Is the RNFL Measured?
    • Retinal Nerve Fiber Layer (RNFL)
      • RNFL Thickness Map
      • RNFL Deviation Map
      • RNFL Tabular Data
      • RNFL Pie Charts
      • RNFL Graph: Basics
    • Statistical Analysis
      • Age-Matched Controls
      • Bell Curve
    • Tabular Data
      • Average RNFL Thickness
      • RNFL Symmetry
      • Rim Area
      • Disc Area
      • Average C/D Ratio
      • Vertical C/D Ratio
      • Cup Volume
    • RNFL Graph: Advanced
      • Blunted Peaks
      • Shifted Peaks
    • Pie Charts
    • Glaucoma Suspect by OCT
    • Red Disease
  • About EyeCarePD
  • Blog
  • FAQ
  • Catalog
  • Contact support
  • Macular OCT Glossary

EyeCarePD Inc.
All Rights Reserved

By using this site you agree
to our Terms and Conditions.

Privacy & Cookies Policy

  • Login
  • Sign Up
Forgot Password?
Lost your password? Please enter your username or email address. You will receive a link to create a new password via email.
body::-webkit-scrollbar { width: 7px; } body::-webkit-scrollbar-track { border-radius: 10px; background: #f0f0f0; } body::-webkit-scrollbar-thumb { border-radius: 50px; background: #dfdbdb }