EyeCarePD

A Clear Vision for Professional Development

  • Catalog
  • FAQ
  • Blog
  • About
  • Contact Us
  • English
  • Log in

RNFL Graph: Advanced

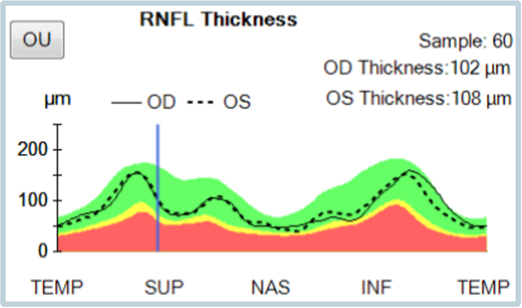
This represents a graphical plot of the RNFL for each point measured along the RNFL Circular Tomogram. Underlying the plot are colorimetric curves that can be used to determine the statistical significance of each point. Commonly used descriptions of this graph include:

  1. Blunted Peaks
  2. Shifted Peaks
« Cup Volume
Blunted Peaks »
  • Glaucoma Glossary
    • Scan Quality
      • Date of Birth
      • Signal Strength
      • Movement Artifact
    • Where Is the RNFL Measured?
    • Retinal Nerve Fiber Layer (RNFL)
      • RNFL Thickness Map
      • RNFL Deviation Map
      • RNFL Tabular Data
      • RNFL Pie Charts
      • RNFL Graph: Basics
    • Statistical Analysis
      • Age-Matched Controls
      • Bell Curve
    • Tabular Data
      • Average RNFL Thickness
      • RNFL Symmetry
      • Rim Area
      • Disc Area
      • Average C/D Ratio
      • Vertical C/D Ratio
      • Cup Volume
    • RNFL Graph: Advanced
      • Blunted Peaks
      • Shifted Peaks
    • Pie Charts
    • Glaucoma Suspect by OCT
    • Red Disease
  • About EyeCarePD
  • Blog
  • FAQ
  • Catalog
  • Contact support
  • Macular OCT Glossary

EyeCarePD Inc.
All Rights Reserved

By using this site you agree
to our Terms and Conditions.

Privacy & Cookies Policy

  • Login
  • Sign Up
Forgot Password?
Lost your password? Please enter your username or email address. You will receive a link to create a new password via email.
body::-webkit-scrollbar { width: 7px; } body::-webkit-scrollbar-track { border-radius: 10px; background: #f0f0f0; } body::-webkit-scrollbar-thumb { border-radius: 50px; background: #dfdbdb }