EyeCarePD

A Clear Vision for Professional Development

  • Catalog
  • FAQ
  • Blog
  • About
  • Contact Us
  • English
  • Log in

RNFL Tabular Data

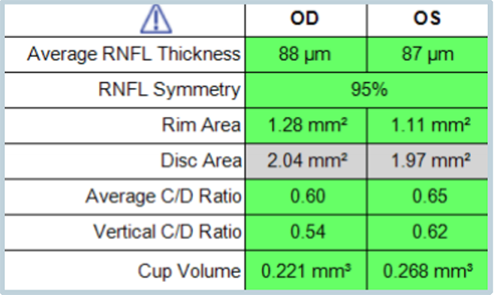
This represents summary data referring to the measurement of the RNFL from the Circular Tomogram. The average of all of the individual points measured is displayed along with a statistical analysis comparing the symmetry of the right and left eye. While not pathognomonic, asymmetry of the RNFL is a common feature of early-onset Glaucoma. The Tabular Data display also uses a background color to denote the statistical significance of this number.

« RNFL Deviation Map
RNFL Pie Charts »
  • Glaucoma Glossary
    • Scan Quality
      • Date of Birth
      • Signal Strength
      • Movement Artifact
    • Where Is the RNFL Measured?
    • Retinal Nerve Fiber Layer (RNFL)
      • RNFL Thickness Map
      • RNFL Deviation Map
      • RNFL Tabular Data
      • RNFL Pie Charts
      • RNFL Graph: Basics
    • Statistical Analysis
      • Age-Matched Controls
      • Bell Curve
    • Tabular Data
      • Average RNFL Thickness
      • RNFL Symmetry
      • Rim Area
      • Disc Area
      • Average C/D Ratio
      • Vertical C/D Ratio
      • Cup Volume
    • RNFL Graph: Advanced
      • Blunted Peaks
      • Shifted Peaks
    • Pie Charts
    • Glaucoma Suspect by OCT
    • Red Disease
  • About EyeCarePD
  • Blog
  • FAQ
  • Catalog
  • Contact support
  • Macular OCT Glossary

EyeCarePD Inc.
All Rights Reserved

By using this site you agree
to our Terms and Conditions.

Privacy & Cookies Policy

  • Login
  • Sign Up
Forgot Password?
Lost your password? Please enter your username or email address. You will receive a link to create a new password via email.
body::-webkit-scrollbar { width: 7px; } body::-webkit-scrollbar-track { border-radius: 10px; background: #f0f0f0; } body::-webkit-scrollbar-thumb { border-radius: 50px; background: #dfdbdb }