EyeCarePD

A Clear Vision for Professional Development

  • Catalog
  • FAQ
  • Blog
  • About
  • Contact Us
  • English
  • Log in

Pie Charts

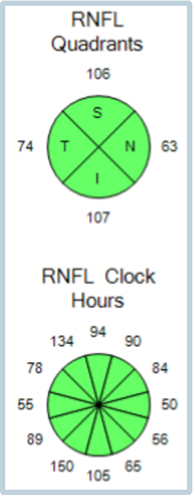
There are two Pie Charts depicting the same RNFL Circular Tomogram data in different ways. One divides the data into quadrants, while the other divides the same data into clock hours. The two different displays (of the same data) allow the user to look for diffuse changes using the quadrant pies and focal changes using the clock-hour pies. The combination of these data limits the risk of overcalling disease. Meanwhile, each section is color coded to allow for statistical interpretation.

« Shifted Peaks
Glaucoma Suspect by OCT »
  • Glaucoma Glossary
    • Scan Quality
      • Date of Birth
      • Signal Strength
      • Movement Artifact
    • Where Is the RNFL Measured?
    • Retinal Nerve Fiber Layer (RNFL)
      • RNFL Thickness Map
      • RNFL Deviation Map
      • RNFL Tabular Data
      • RNFL Pie Charts
      • RNFL Graph: Basics
    • Statistical Analysis
      • Age-Matched Controls
      • Bell Curve
    • Tabular Data
      • Average RNFL Thickness
      • RNFL Symmetry
      • Rim Area
      • Disc Area
      • Average C/D Ratio
      • Vertical C/D Ratio
      • Cup Volume
    • RNFL Graph: Advanced
      • Blunted Peaks
      • Shifted Peaks
    • Pie Charts
    • Glaucoma Suspect by OCT
    • Red Disease
  • About EyeCarePD
  • Blog
  • FAQ
  • Catalog
  • Contact support
  • Macular OCT Glossary

EyeCarePD Inc.
All Rights Reserved

By using this site you agree
to our Terms and Conditions.

Privacy & Cookies Policy

  • Login
  • Sign Up
Forgot Password?
Lost your password? Please enter your username or email address. You will receive a link to create a new password via email.
body::-webkit-scrollbar { width: 7px; } body::-webkit-scrollbar-track { border-radius: 10px; background: #f0f0f0; } body::-webkit-scrollbar-thumb { border-radius: 50px; background: #dfdbdb }