EyeCarePD

A Clear Vision for Professional Development

  • Catalog
  • FAQ
  • Blog
  • About
  • Contact Us
  • English
  • Log in

Average RNFL Thickness

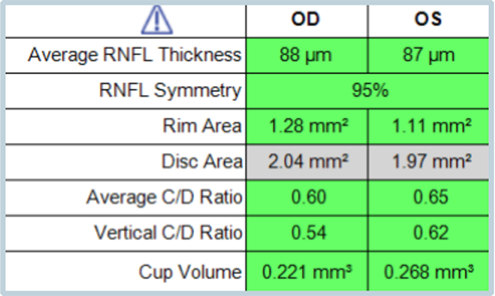
This number represents the average thickness across the Circular Tomogram. It provides an excellent representation of diffuse change. But be aware that small, and clinically significant, changes will not be reflected by this number. Additionally, the statistical analysis indicated by the color code (green, yellow, red, white) is the most critical aspect.

« Tabular Data
RNFL Symmetry »
  • Glaucoma Glossary
    • Scan Quality
      • Date of Birth
      • Signal Strength
      • Movement Artifact
    • Where Is the RNFL Measured?
    • Retinal Nerve Fiber Layer (RNFL)
      • RNFL Thickness Map
      • RNFL Deviation Map
      • RNFL Tabular Data
      • RNFL Pie Charts
      • RNFL Graph: Basics
    • Statistical Analysis
      • Age-Matched Controls
      • Bell Curve
    • Tabular Data
      • Average RNFL Thickness
      • RNFL Symmetry
      • Rim Area
      • Disc Area
      • Average C/D Ratio
      • Vertical C/D Ratio
      • Cup Volume
    • RNFL Graph: Advanced
      • Blunted Peaks
      • Shifted Peaks
    • Pie Charts
    • Glaucoma Suspect by OCT
    • Red Disease
  • About EyeCarePD
  • Blog
  • FAQ
  • Catalog
  • Contact support
  • Macular OCT Glossary

EyeCarePD Inc.
All Rights Reserved

By using this site you agree
to our Terms and Conditions.

Privacy & Cookies Policy

  • Login
  • Sign Up
Forgot Password?
Lost your password? Please enter your username or email address. You will receive a link to create a new password via email.
body::-webkit-scrollbar { width: 7px; } body::-webkit-scrollbar-track { border-radius: 10px; background: #f0f0f0; } body::-webkit-scrollbar-thumb { border-radius: 50px; background: #dfdbdb }